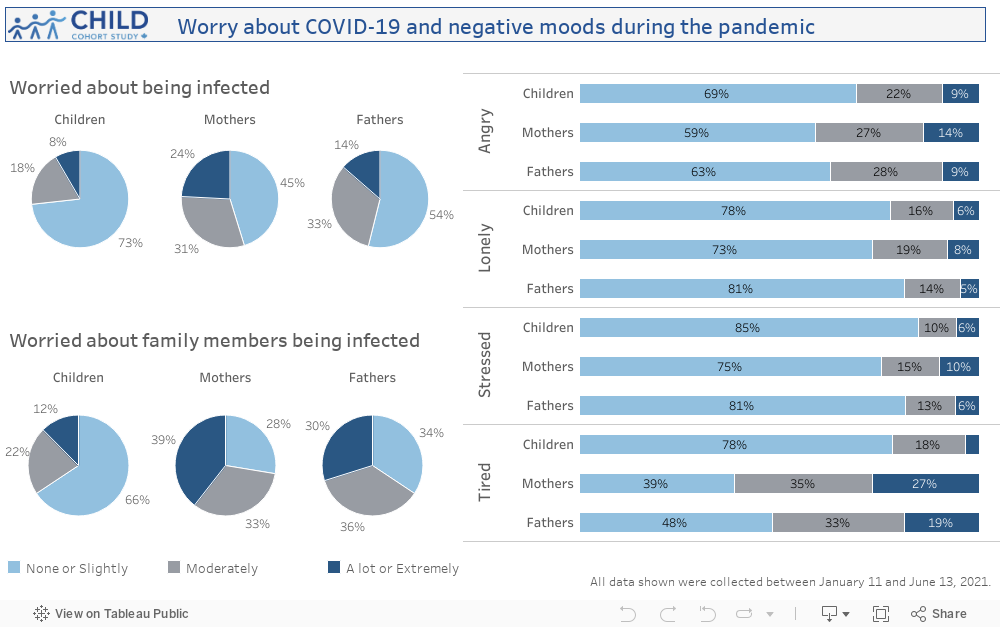
Stress & Coping: Worry about infection & negative moods
Overall, parents reported higher levels of pandemic-related worry than children. Parents were about twice as worried about potential COVID-19 infection as their kids. About 50% of parents were moderately to extremely worried about becoming infected themselves, and around 70% were similarly worried about their family members becoming infected.
Parents reported being considerably more tired under pandemic conditions than children. Around 50-60% of parents were moderately to extremely tired, while only 20% of children reported such feelings. Parents reported slightly higher levels of other negative feelings than children; parental levels of anger, loneliness and stress were less prevalent than tiredness.
The data charts on this page have not yet been optimized for mobile screens. To see the charts properly, please view this page in landscape mode (rotate your phone onto its side) or on a larger screen.
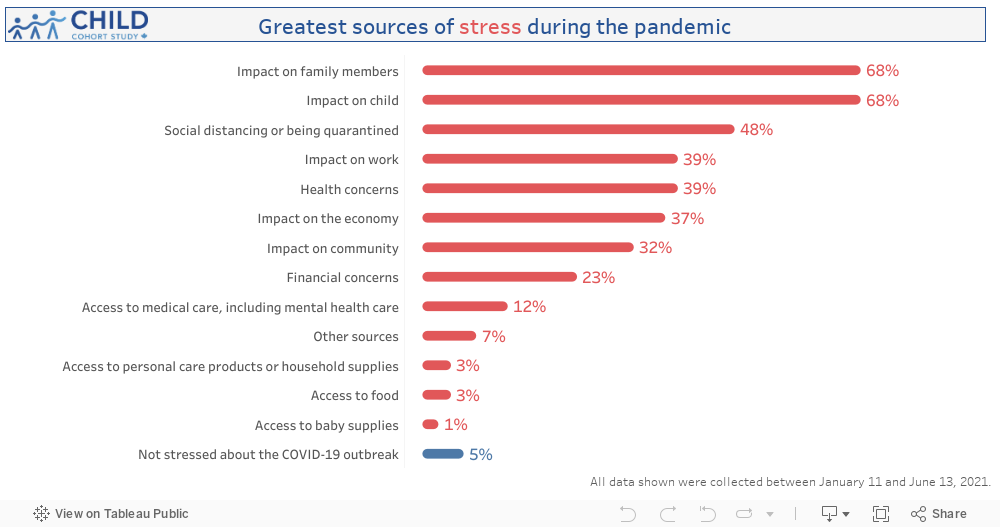
Stress & Coping: Greatest sources of stress from the pandemic
Concerns about the pandemic’s impact on family members and children was the most common (68%) reported source of pandemic-related stress. Stress over other impacts (on health, work, the economy, and the community) were shared by 30-50% of respondents. Only 5% reported experiencing no pandemic-related stress.
The data charts on this page have not yet been optimized for mobile screens. To see the charts properly, please view this page in landscape mode (rotate your phone onto its side) or on a larger screen.
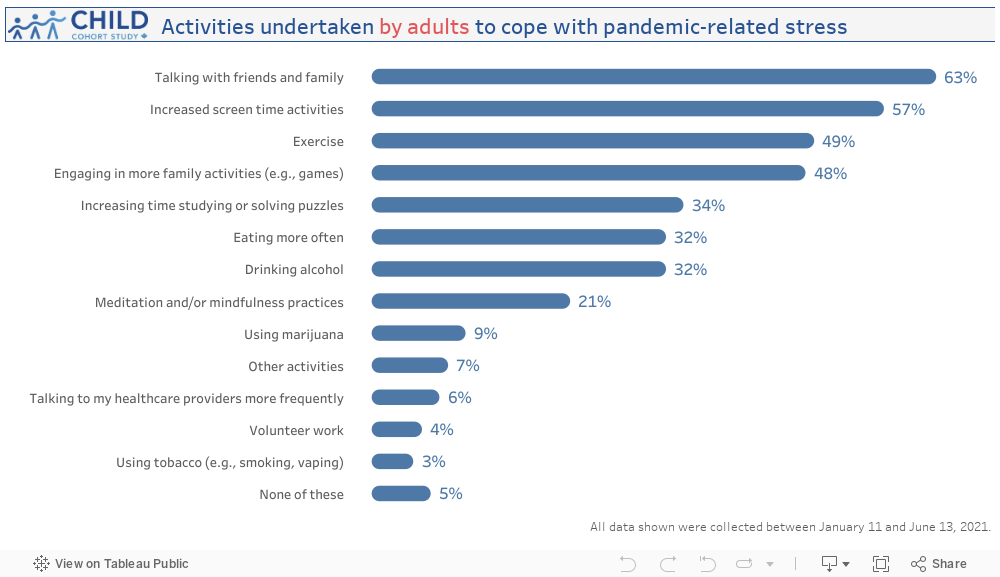
Stress & Coping: Activities undertaken to cope with pandemic-related stress (REPORTED BY ADULTS ONLY)
About 50%-60% of adults reported social support (talking with friends and family), exercise, family activities and screen time as activities that helped them cope with pandemic-related stress. About a third found themselves coping through intellectual exercises (study or puzzles), eating more or drinking more alcohol, with lower rates of reporting for other stress-relieving activities.
The data charts on this page have not yet been optimized for mobile screens.To see the charts properly, please view this page in landscape mode (rotate your phone onto its side) or on a larger screen.